Content:
- Overview
- Tools, options and filters
- Summary window
- Overview Table
Overview
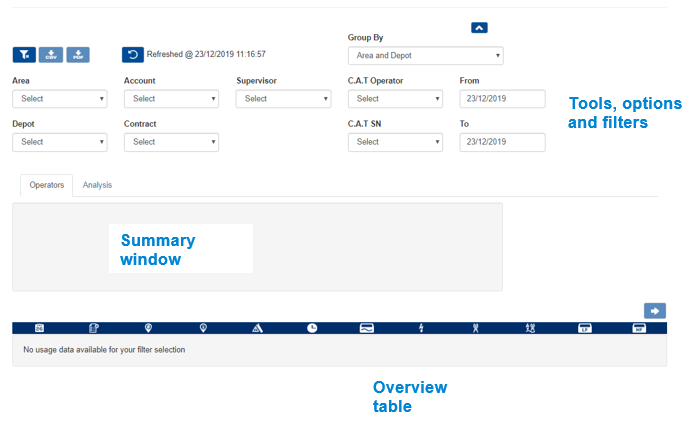
The C.A.T Operators Usage Overview screen has 3 different sections:
- Tools, Options and Filters
- Summary Window
- Overview Table
Tools, options & filters.
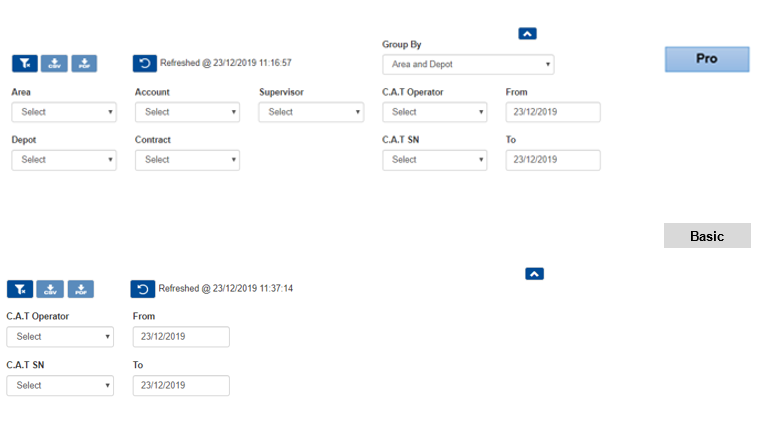
This section provides a number of commands, options and filters to help review your company’s data.
Area, Depot, Account, Contract and Supervisor are only available on the Pro subscription.
Available commands are:
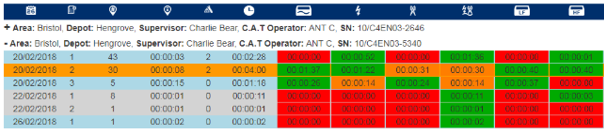
Pro users have the option to change the grouping of the table data:
Group by Area and Depot (default option)
or by Account and Contract
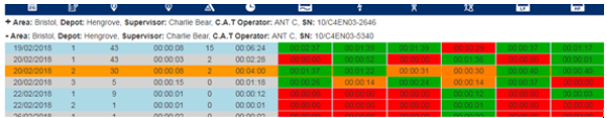
Show individual surveys summary
This option, selected by default, displays all the individual surveys, for each day, in the overview table.
A survey is a collection of scans, (C.A.T operations) to survey a specific location.

Filters provide a quick and easy way to narrow down usage data to a specific subset.
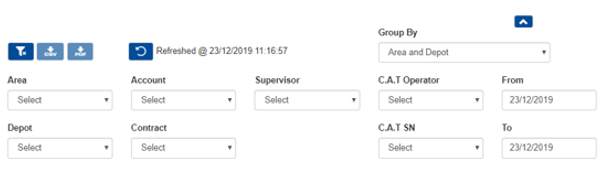
- Filter by Areas, Depots, Contracts, Accounts and Supervisors (Pro subscription required)
- Filter by C.A.T operators and C.A.T serial numbers
- Filter by a Date range
The From - To date range cannot be empty
Filters are automatically applied when a selection is made and will affect all the others. For example, if you select a specific user all the other filters will only show values available to that specific user.
To reset the filters press the Clear filter button.
NOTE: When opening the dashboard screen the date filter range is set to the current date: the overview table and the filters may be empty if no C.A.T usage is available for the day.
Summary Window
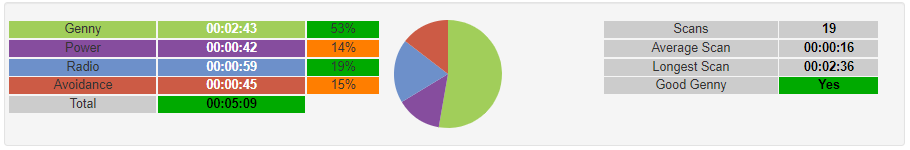
The summary window becomes active when hovering with your mouse over the C.A.T data in the overview table below and shows the scans summary of the day or survey highlighted in yellow.
You can lock a specific survey by clicking anywhere on the desired row which will turn partially orange.
To unlock click again on the highlighted row.
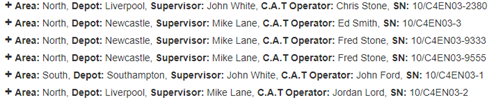
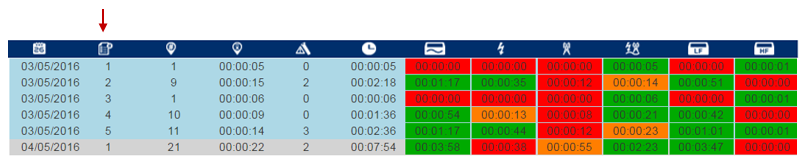
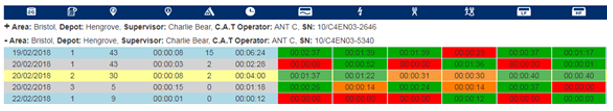
Usage Overview Table
Overview Table
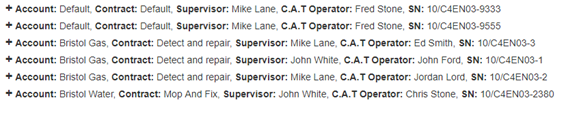
The overview table shows the data available for the applied filters, grouped by users and C.A.T SN.
NOTE: When you first access the dashboard, the date range filter is set to today’s date.
The overview table provides the following information:
* Measured in hh:mm:ss